4 Lessons From the 2023 Aline Benchmark Report
Get the data-driven insights you need to optimize your sales and marketing efforts.

Get the data-driven insights you need to optimize your sales and marketing efforts.
To stay ahead in this complex market, it’s not enough to base your sales and marketing plans on intuition. Senior living operators need industry-specific, data-driven insights to optimize their performance and exceed their revenue goals, and that’s exactly why we’re proud to bring you the 2023 Aline Sales and Marketing Benchmark Report for Senior Housing.
This comprehensive report offers an in-depth analysis of current sales and marketing performance metrics, specifically for the senior living industry. Whether you’re looking to refine your marketing strategies or improve your sales techniques, this report gives you the insights you need to grow your market share and outperform your competitors. Download the Aline Benchmark Report now to dive into our findings.
Now that you have the Aline Benchmark Report handy, let’s review four lessons you can start applying to your own business.
For all care levels, communities brought in an average of 38 inquiries per month for a 6% increase from 2022. So what brought that growth? We can attribute that to:
With these better marketing capabilities, senior living operators should use their CRM as more than just a task manager — it’s an important sales enablement tool for improving the quality of move-ins and growing the lengths of stay for residents.
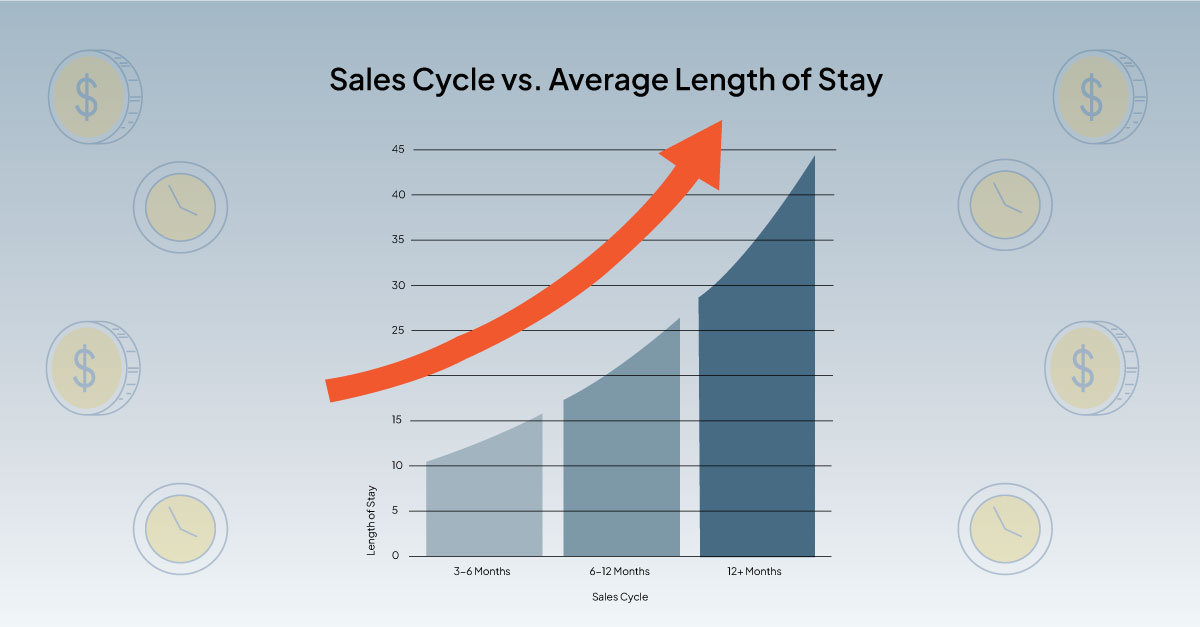
According to the Aline Benchmark Report, 53% of move-outs came from residents with a 30-day or less sales cycle with an 18-month average length of stay. Now consider how the length of stay increases along with the sales cycle.
This increased length of stay directly affects your revenue margin and bottom line. Prospects who took a year or longer to move in averaged 21 additional months of revenue. When you compound that per prospect across multiple communities, this adds up quickly.
Of course, short-cycle prospects still have a place in your pipeline, but you should balance those prospects with long-cycle prospects. Using your Aline CRM, you can see how long it took your prospects over the last year to move through the sales journey.
We recommend balancing those quick move-ins 2:1 or 1:1 with longer sales cycles and low-acuity move-ins to create a stable, manageable length of stay. If your sales team moves prospects through the sales journey too quickly, it may be time to invest in professional sales training to help them better understand how to properly nurture prospects to ensure they move in the right prospects at the right time.
In addition to sales training, you can provide a better, more seamless sales experience by connecting your CRM to all core operational outputs — from accounting and billing to care and resident engagement. By involving the accounting and billing team from the start, they have full visibility into pricing conversations and agreements and can quickly flag any issues before the sales rep and prospect move further down the funnel.
For care and resident engagement, this provides the care team with a look at a prospect’s unique needs. If the prospect comes in for a tour, the care team can be ready with a personalized plan that addresses these needs.
While our report found that inquiries reached an all-time high in 2023 across the average of care levels, conversions slightly dropped.
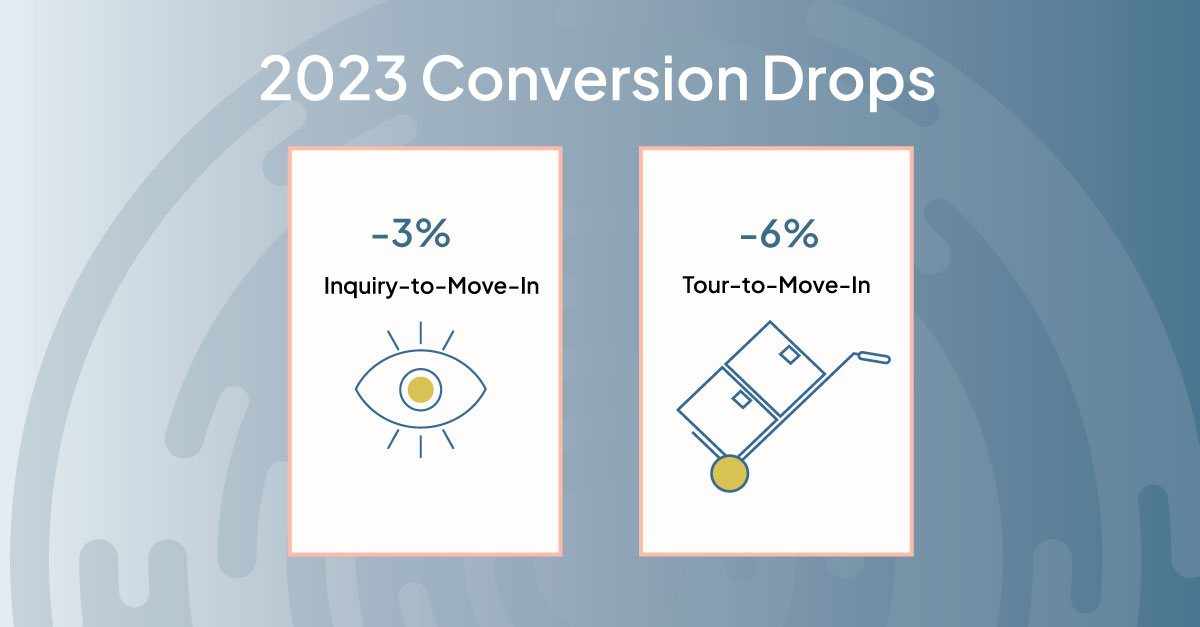
But this isn’t a reason to worry. In fact, increased inquiries should result in lower conversion rates. Not everyone in your sales funnel can move into your community. And then there’s the influx of lead aggregators, web leads, and increased competition as the market has evolved — all of which can lead to a drop in conversions.
To understand the full conversion story, look at the average move-in rate as well. This metric held relatively stable.
That’s not to say you shouldn’t track conversions. Understanding past performance helps you identify the most effective sales strategies, flag areas for improvement, measure ROI, and gain insights into prospect behavior.
Putting these pieces together is critical for developing an effective sales strategy that helps you meet your occupancy goals. Just make sure you look at the whole picture to properly access your performance.
Some other industry reports only look at regional performance, but we took it a step further to give you a more complete view. We also included data for urban and rural markets. If you operate a community in a rural town in the Midwest, you cannot expect to set the same sales performance benchmarks for your community in Chicago.
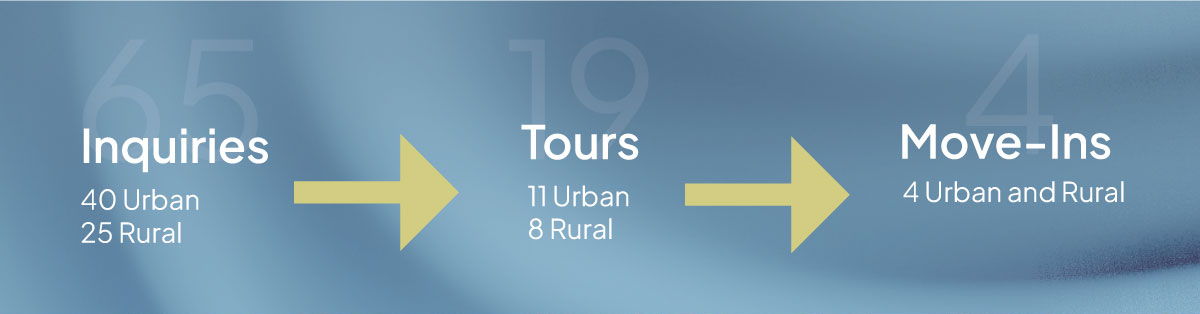
According to the benchmark data, urban communities received an average of 40 inquiries per month in 2023 while rural communities received an average of 25 inquiries per month. That’s a 38% difference between the two markets.
The number of tours also widely varied between the two markets. Urban communities conducted an average of 11 tours per month in 2023 compared to eight tours per month for rural communities, marking a 27% difference.
However, the gap closes when it comes to move-ins. Both markets averaged four move-ins per month for the average sized building in those markets.
So why do urban communities start out with so many more inquiries but end up with the same number of move-ins as rural markets? This comes down to competition, which makes lead generation even more important for urban communities.
Pro tip: Our CRM allows you to set goals for inquiry, so make sure you set different numbers for your urban communities and rural communities.
Even in 2023, call-ins remained one of the most popular inquiry methods, according to our data. For all care levels, we found that call-ins accounted for 25% of inquiry methods.
In today’s online world, that may be surprising, but it’s understandable when you consider the nuances of our industry. This transition is an emotional, personal, and often difficult decision for many prospects and their families. From the first touch, many prospects want to connect with a real person and have a serious conversation. If they’re calling you, they’re also calling your competitors, which is why speed-to-lead is especially important.
For many communities, that isn’t as easy as it sounds. If you run a small sales team, they may not have the manpower to handle the volume of calls. Or the sales reps could be busy in the field on home visits or giving tours — as they should. Those are impactful sales activities that help advance the sales funnel, but you also don’t want to sacrifice new hot leads.
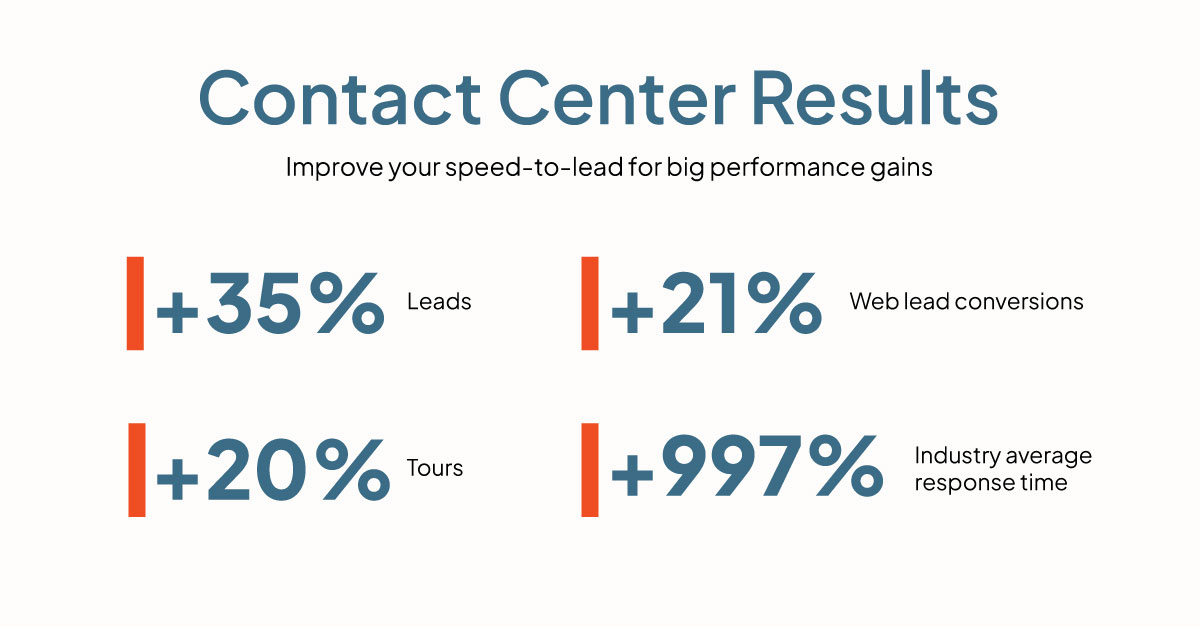
In these situations, we find implementing a contact center is an effective way to improve speed-to-lead for both calls and web forms, which are still a big driver of inquiries. In fact, we’ve worked closely with some of the top-performing operators across the country and have seen impressive results when they invested in this kind of support.
For a deeper look into current senior living sales and marketing stats, download the 2023 Aline Sales and Marketing Benchmark Report today. Get the intelligence you need to build a thriving senior living business.

Aline
Aline helps senior care operators bring clarity to complex operations by connecting marketing, sales, clinical, dining, and financial systems on one unified platform. Serving more than 9,000 communities, Aline brings together CRM, care, billing, payments, and business intelligence so teams have shared visibility and fewer tools to manage.
Blogs, stories and studies from the forefront of senior living operations
Lead generation surveys give senior living operators the data they need to understand their market, uncover new opportunities, and drive occupancy growth.
Prospect-centered selling helps senior living operators convert more leads and achieve occupancy goals through a more personalized, empathetic approach.
Gain insight into senior living pricing strategies for community success. Explore how Aline’s software optimizes revenue and operations
Overcome the biggest senior living financial challenges, including operational costs and occupancy rates, with interconnected software
Take a look at how senior living software options, like Aline, can elevate operations, resident care, and ROI
Enhance efficiency, accuracy, and resident satisfaction by integrating a POS system into your senior living dining operations